

Elasticsearch和Kibana的启动报错问题——Kibana服务器尚未准备就绪、Elasticsearch启动失败ERROR: failed to obtain node locks
目录
1 问题1:Elasticsearch启动失败ERROR: failed to obtain node locks
1.1 问题描述
1.2 解决方案
2 问题2:Kibana服务器尚未准备就绪
2.1 问题描述
2.2 解决方案
在这里分享一下使用docker compose启动Elasticsearch和Kibana遇到的两个问题的解决方案。
1 问题1:Elasticsearch启动失败ERROR: failed to obtain node locks
1.1 问题描述
使用docker compose方式启动Elasticsearch,结果启动失败:

使用如下命令查看启动日志:
docker logs 容器名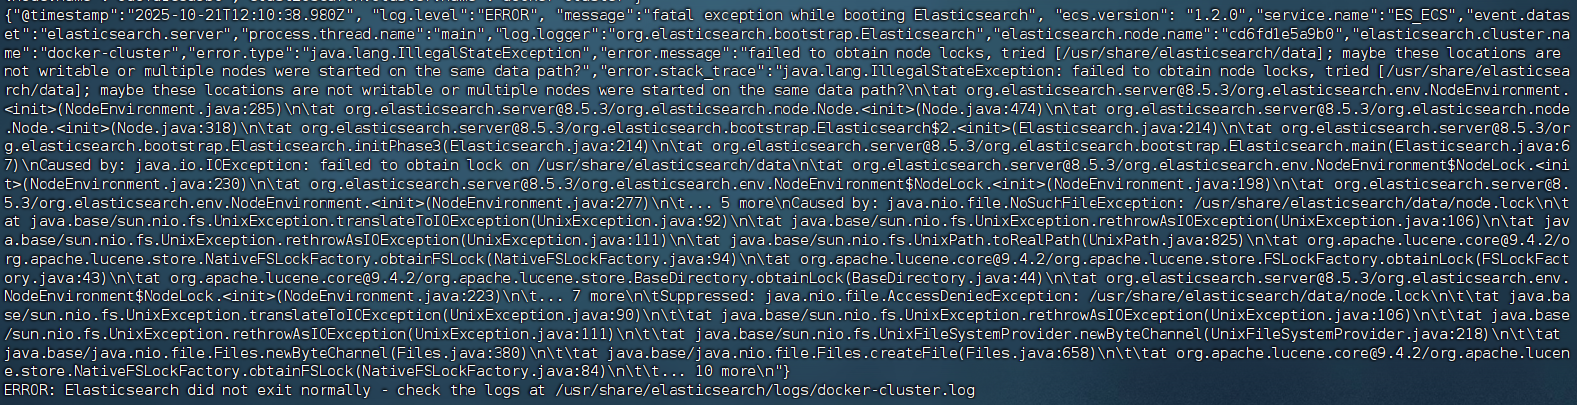
核心报错内容为:
ERROR: failed to obtain node locks, tried [/usr/share/elasticsearch/data]; maybe these locations are not writable or multiple nodes were started on the same data path?表示 Elasticsearch 无法获取数据目录的锁(node.lock )。
1.2 解决方案
我在docker compose文件中配置了data目录的挂载路径:
    volumes:
      - ./elasticsearch/es-plugins:/usr/share/elasticsearch/plugins
- ../data/elasticsearch/data:/usr/share/elasticsearch/data该问题的原因是Elasticsearch在启动时会尝试在挂载的数据路径中创建一个名为node.lock的文件锁(默认数据路径为/usr/share/elasticsearch/data)。该锁的作用是:防止多个节点进程同时访问同一份数据,避免数据损坏;确保单节点模式下不会“自相残杀”。
而在向宿主机的挂载路径写入该文件锁时,Elasticsearch容器默认使用用户elasticsearch(UID=1000)运行。如果宿主机上的 ../data/elasticsearch/data 目录属于其他用户(如 root),则容器将无权写入,从而无法创建 node.lock 。
因此解决方案就是为UID为1000的用户配置文件路径的读写权限:
sudo chown -R 1000:1000 ../data/ojonlinedata/elasticsearch/data 停止并重启容器即可解决。
2 问题2:Kibana服务器尚未准备就绪
2.1 问题描述
使用docker compose同时启动Elasticsearch和Kibana,docker ps命令显示Elasticsearch启动状态是Healthy,但是Kibana的前端页面始终显示:

进去Kibana容器查看启动日志,总是显示在不断重试:
[2025-10-21T10:39:03.369+00:00][ERROR][savedobjects-service] [.kibana] Action failed with '[index_not_green_timeout] Timeout waiting for the status of the [.kibana_8.5.3_001] index to become 'green' Refer to https://www.elastic.co/guide/en/kibana/8.5/resolve-migrations-failures.html#_repeated_time_out_requests_that_eventually_fail for information on how to resolve the issue.'. Retrying attempt 1 in 2 seconds.
[2025-10-21T10:39:03.370+00:00][INFO ][savedobjects-service] [.kibana] CREATE_NEW_TARGET -> CREATE_NEW_TARGET. took: 60050ms.
最终重试15次后彻底失败:
FATAL Error: Unable to complete saved object migrations for the [.kibana] index: Unable to complete the CREATE_NEW_TARGET step after 15 attempts, terminating. The last failure message was: [index_not_green_timeout] Timeout waiting for the status of the [.kibana_8.5.3_001] index to become 'green' Refer to https://www.elastic.co/guide/en/kibana/8.5/resolve-migrations-failures.html#_repeated_time_out_requests_that_eventually_fail for information on how to resolve the issue.这段日志主要含义是Kibana在等待Elasticsearch的状态为green,而Elasticsearch的状态为一直无法变为green,导致 Kibana 在初始化时无法完成索引创建和数据迁移。该状态才能确保Elasticsearch的可用。
2.2 解决方案
进入Elasticsearch容器的查看启动日志,发现:
{"@timestamp":"2025-10-21T11:50:48.491Z", "log.level":"ERROR", "message":"exception during geoip databases update", "ecs.version": "1.2.0","service.name":"ES_ECS","event.dataset":"elasticsearch.server","process.thread.name":"elasticsearch[d9ea98a14187][generic][T#2]","log.logger":"org.elasticsearch.ingest.geoip.GeoIpDownloader","elasticsearch.cluster.uuid":"gBTVn-m0QcyJe78CmheDMQ","elasticsearch.node.id":"HWK9LjnKQdCwvhBG_QRmHQ","elasticsearch.node.name":"d9ea98a14187","elasticsearch.cluster.name":"docker-cluster","error.type":"org.elasticsearch.ElasticsearchException","error.message":"not all primary shards of [.geoip_databases] index are active","error.stack_trace":"org.elasticsearch.ElasticsearchException: not all primary shards of [.geoip_databases] index are active
	at org.elasticsearch.ingest.geoip@8.5.3/org.elasticsearch.ingest.geoip.GeoIpDownloader.updateDatabases(GeoIpDownloader.java:134)
	at org.elasticsearch.ingest.geoip@8.5.3/org.elasticsearch.ingest.geoip.GeoIpDownloader.runDownloader(GeoIpDownloader.java:274)
	at org.elasticsearch.ingest.geoip@8.5.3/org.elasticsearch.ingest.geoip.GeoIpDownloaderTaskExecutor.nodeOperation(GeoIpDownloaderTaskExecutor.java:102)
	at org.elasticsearch.ingest.geoip@8.5.3/org.elasticsearch.ingest.geoip.GeoIpDownloaderTaskExecutor.nodeOperation(GeoIpDownloaderTaskExecutor.java:48)
	at org.elasticsearch.server@8.5.3/org.elasticsearch.persistent.NodePersistentTasksExecutor$1.doRun(NodePersistentTasksExecutor.java:42)
	at org.elasticsearch.server@8.5.3/org.elasticsearch.common.util.concurrent.ThreadContext$ContextPreservingAbstractRunnable.doRun(ThreadContext.java:892)
	at org.elasticsearch.server@8.5.3/org.elasticsearch.common.util.concurrent.AbstractRunnable.run(AbstractRunnable.java:26)
	at java.base/java.util.concurrent.ThreadPoolExecutor.runWorker(ThreadPoolExecutor.java:1144)
	at java.base/java.util.concurrent.ThreadPoolExecutor$Worker.run(ThreadPoolExecutor.java:642)
	at java.base/java.lang.Thread.run(Thread.java:1589)
"}
{"@timestamp":"2025-10-21T11:52:17.390Z", "log.level": "WARN", "message":"high disk watermark [90%] exceeded on [HWK9LjnKQdCwvhBG_QRmHQ][d9ea98a14187][/usr/share/elasticsearch/data] free: 923.5mb[5.3%], shards will be relocated away from this node; currently relocating away shards totalling [0] bytes; the node is expected to continue to exceed the high disk watermark when these relocations are complete", "ecs.version": "1.2.0","service.name":"ES_ECS","event.dataset":"elasticsearch.server","process.thread.name":"elasticsearch[d9ea98a14187][masterService#updateTask][T#1]","log.logger":"org.elasticsearch.cluster.routing.allocation.DiskThresholdMonitor","elasticsearch.cluster.uuid":"gBTVn-m0QcyJe78CmheDMQ","elasticsearch.node.id":"HWK9LjnKQdCwvhBG_QRmHQ","elasticsearch.node.name":"d9ea98a14187","elasticsearch.cluster.name":"docker-cluster"}Elasticsearch日志中频繁出现的磁盘水位警告,当磁盘使用率 > 90%,Elasticsearch 会停止在此节点上分配新分片(shard),并尝试将已有分片迁出(而我部署的是单节点模式)。
如果没有其他节点可迁移,则所有新建索引的primary shard将无法被激活 ,状态永远不是green或yellow,因此Kibana也就永远无法等到启动成功。
解决方案就是为容器的data目录挂载空间足够的宿主机路径:
volumes:
  - ./elasticsearch/data:/usr/share/elasticsearch/data
同时,增加Java内存空间的上限(2GB):
ES_JAVA_OPTS: "-Xms1g -Xmx1g"然后重启容器,Elasticsearch是否启动成功可以通过如下URL(将ip切换为自己的)验证:
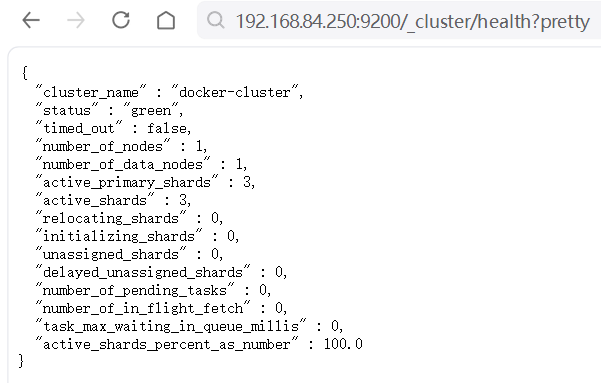
如果status是green,则说明Elasticsearch启动成功且可用。
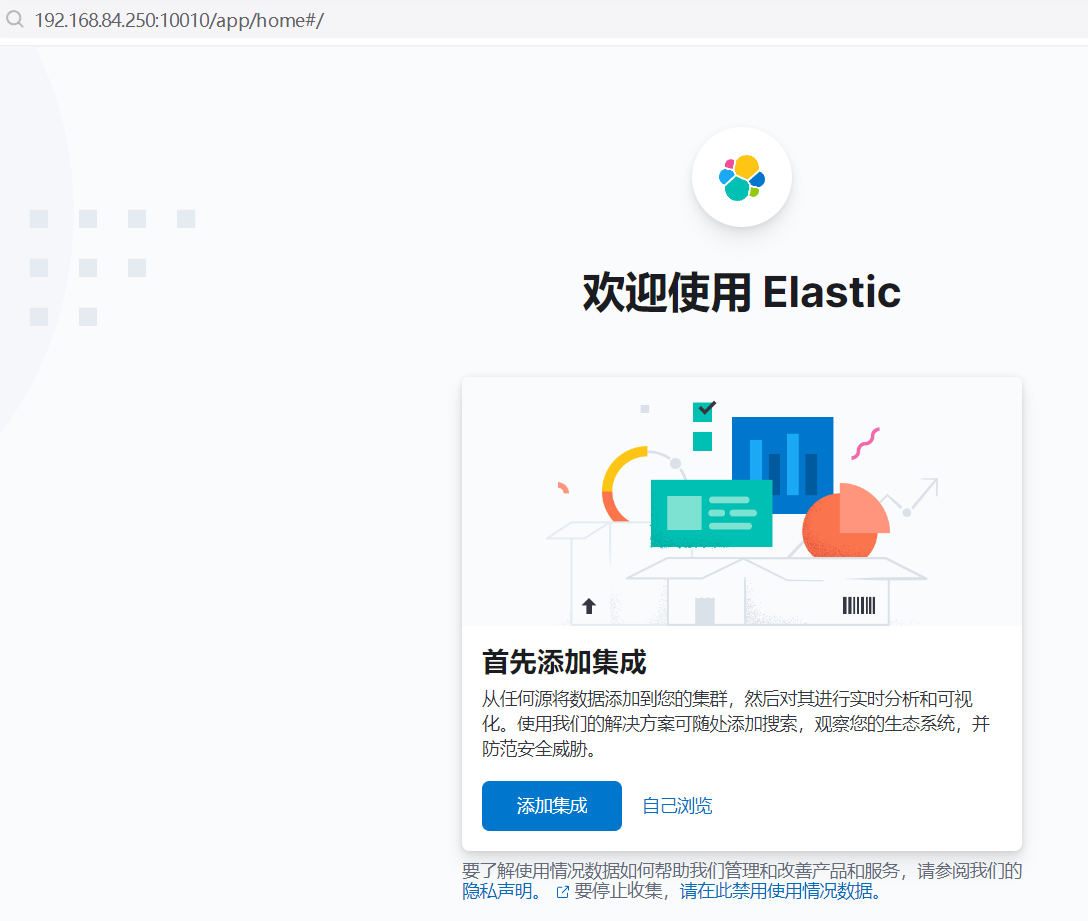
此时访问Kibana就会正常显示: